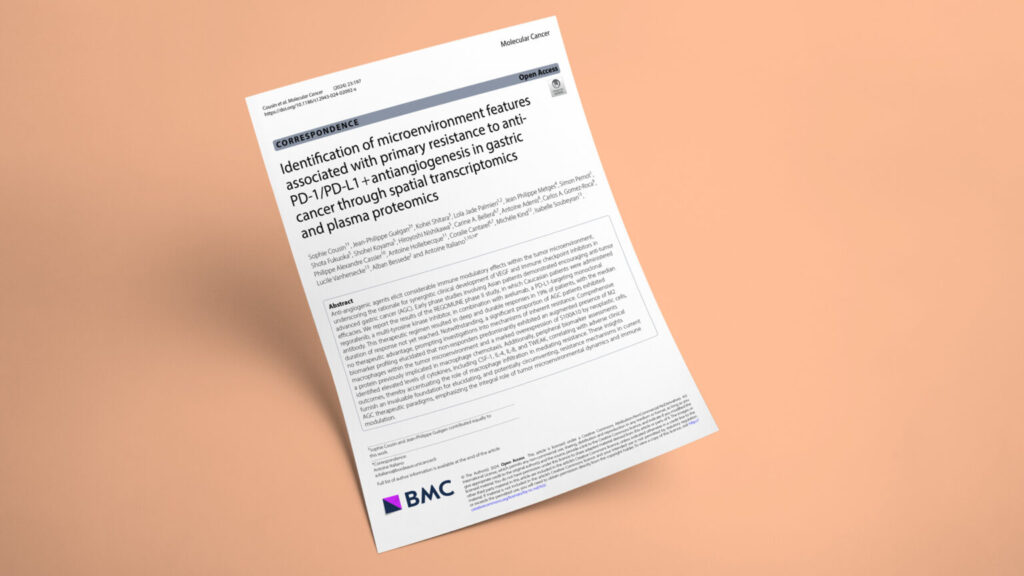
Publication in Molecular Cancer

Why do gastric cancers resist PD-1 plus antiangiogenesis? Spatial and plasma profiling points to M2 macrophages

Identification of microenvironment features associated with primary resistance to anti-PD-1/PD-L1 + antiangiogenesis in gastric cancer through spatial transcriptomics and plasma proteomics
JournalMolecular Cancer
DateSep 2026
Read full paper →

Pairing VEGF inhibitors with checkpoint blockade is a rational combination in advanced gastric cancer, but many patients simply don't respond — and why has been unclear. The REGOMUNE phase 2 trial paired regorafenib with avelumab, producing deep, durable responses in 19% of patients while a substantial subset showed no benefit. To find the resistance mechanism, Explicyte profiled tumors and blood across the REGOMUNE and REGONIVO cohorts using spatial transcriptomics, multiplex immunofluorescence, and plasma proteomics. Non-responders were defined by M2 macrophage enrichment, tumor-cell overexpression of the macrophage-recruiting protein S100A10, and high circulating CSF-1 — pointing to tumor-associated macrophages as the barrier to overcome.

This study, led by Prof. Antoine Italiano across the Bergonié and Gustave Roussy Comprehensive Cancer Centers, asked why a substantial share of advanced gastric cancer patients fail to respond to checkpoint blockade combined with antiangiogenic therapy. In the phase 2 REGOMUNE trial, 49 patients with advanced gastric cancer received avelumab (a PD-L1 inhibitor) with regorafenib (a multi-kinase tyrosine kinase inhibitor). The work was sponsored by Institut Bergonié and funded by Bayer. Explicyte ran the entire correlative biomarker program that gives the paper its findings — GeoMx DSP spatial transcriptomics, two multiplex immunohistofluorescence panels quantified by digital pathology, and Olink plasma proteomics — profiling responders and non-responders across the REGOMUNE and REGONIVO cohorts.

The question

What features of the tumor microenvironment drive primary resistance to combined PD-1/PD-L1 blockade and antiangiogenesis in advanced gastric cancer?

Key steps

  1. 1

    Spatial transcriptomics flags the immune compartment

    Explicyte used NanoString GeoMx DSP with the Whole Transcriptome Atlas to profile over 18,000 protein-coding genes across six tumors — three responders and three non-responders — from the REGOMUNE and REGONIVO studies (both pairing regorafenib with checkpoint inhibition). Regions were segmented into PanCK+ tumor and CD45+ immune compartments. Unsupervised clustering cleanly separated responders from non-responders in the immune compartment, where the macrophage marker CD163 was significantly overexpressed in resistant tumors, and the tumor compartment showed strong upregulation of S100A10 — a protein involved in macrophage chemotaxis — in non-responders.

  2. 2

    Digital pathology validates M2 macrophage enrichment

    To validate the signal, Explicyte developed two multiplex immunohistofluorescence panels on the Ventana Discovery platform (panel 1: CD8/CD11b/CD68/HLA-DR/PanCK to resolve M1 vs M2 macrophages; panel 2: S100A10/PanCK), imaged on the Akoya PhenoImager HT and quantified by digital pathology across 43 baseline tumor biopsies. Resistant tumors showed significantly more M2 macrophages and a higher M2/M1 ratio (HR for PFS 0.32, p = 0.005), and non-responders overexpressed S100A10 in tumor cells — confirming the spatial-transcriptomic findings at protein level.

  3. 3

    Plasma proteomics extends resistance to a blood signature

    Explicyte profiled baseline plasma from REGOMUNE and REGONIVO patients using the Olink Target 96 Immuno-Oncology panel. Macrophage-associated cytokines — CSF-1, IL-4, IL-8, and TWEAK — were significantly upregulated in patients with worse outcomes, and correlated with tissue M2 abundance. High plasma CSF-1 alone marked markedly worse outcomes: PFS 1.78 vs 4.41 months (p < 0.001), OS 7.2 vs 13.48 months (p = 0.009), and an objective response rate of 0% vs 43.2% (p = 0.003) versus CSF-1-low patients.

  4. 4

    A convergent, macrophage-centered resistance mechanism

    Across all three platforms the same picture emerged: primary resistance to PD-1/PD-L1 plus antiangiogenesis in gastric cancer is defined by tumor-associated M2 macrophages, recruited via an S100A10/Annexin A2 tumor-cell program and a CSF-1/IL-4/IL-8/TWEAK cytokine milieu. Notably, PD-L1 expression (Combined Positive Score) did not distinguish responders from non-responders — the macrophage axis, not PD-L1, tracked with benefit.

Impact

The study converts an unexplained clinical failure into a defined, measurable resistance mechanism — and nominates the biomarkers to detect it in tissue and in blood.

19%
of gastric cancer patients had deep, durable responses to regorafenib + avelumab (REGOMUNE)
HR 0.32
better progression-free survival for tumors with a low M2/M1 macrophage ratio (p = 0.005)
0% vs 43%
objective response rate in plasma CSF-1-high vs CSF-1-low patients (p = 0.003)

For developers combining checkpoint inhibitors with antiangiogenics in gastric cancer, this argues that adding a VEGF TKI to PD-1/PD-L1 blockade is not enough when tumor-associated macrophages dominate the microenvironment — and that macrophage-directed strategies (CSF-1R blockade, S100A10/macrophage-reprogramming approaches) are the logical next combination partner. Just as important, it delivers a practical patient-selection toolkit: an M2/M1 IHF ratio and tumor S100A10 in tissue, plus plasma CSF-1 as an accessible blood biomarker, all outperforming PD-L1 CPS for predicting benefit. The three-platform design — spatial transcriptomics for discovery, multiplex IF for tissue validation, Olink for a blood readout — is directly reusable for resistance-biomarker programs in other indications.

Investigating resistance to checkpoint or antiangiogenic combinations and need spatial transcriptomics, multiplex-IF macrophage profiling, or Olink plasma biomarkers to find it? Let's talk.

Talk to us
Explicyte Oncology CRO logo

Capabilities

Modalities