Immune function & modulation

Immune cell activation assay

Does your compound switch immune cells on — driving proliferation and cytokine release — or hold that response back?

This in vitro assay reads immune cell activation directly: primary human PBMCs or purified T cells are stimulated through the TCR, proliferation is tracked by live-cell imaging, and effector cytokines (IFN-γ, IL-2, TNF-α) are quantified by HTRF — benchmarked against anti-PD-1 and anti-PD-L1 standards.

Immune cell activation assay: format & readouts
Format
96-well plate
Model
Primary human PBMCs, or a purified subset such as T cells
Activator
Anti-CD3 (TCR ligation), or another defined immune stimulus
Readouts
Proliferation by automated live-cell imaging; effector cytokine release (IFN-γ, IL-2, TNF-α) by HTRF or LEGENDplex
Standards
Anti-PD-1 (nivolumab, pembrolizumab) and anti-PD-L1 (atezolizumab)
On request
Flow cytometry immunophenotyping (checkpoint and activation markers), cytokine array, proteomics, transcriptomics
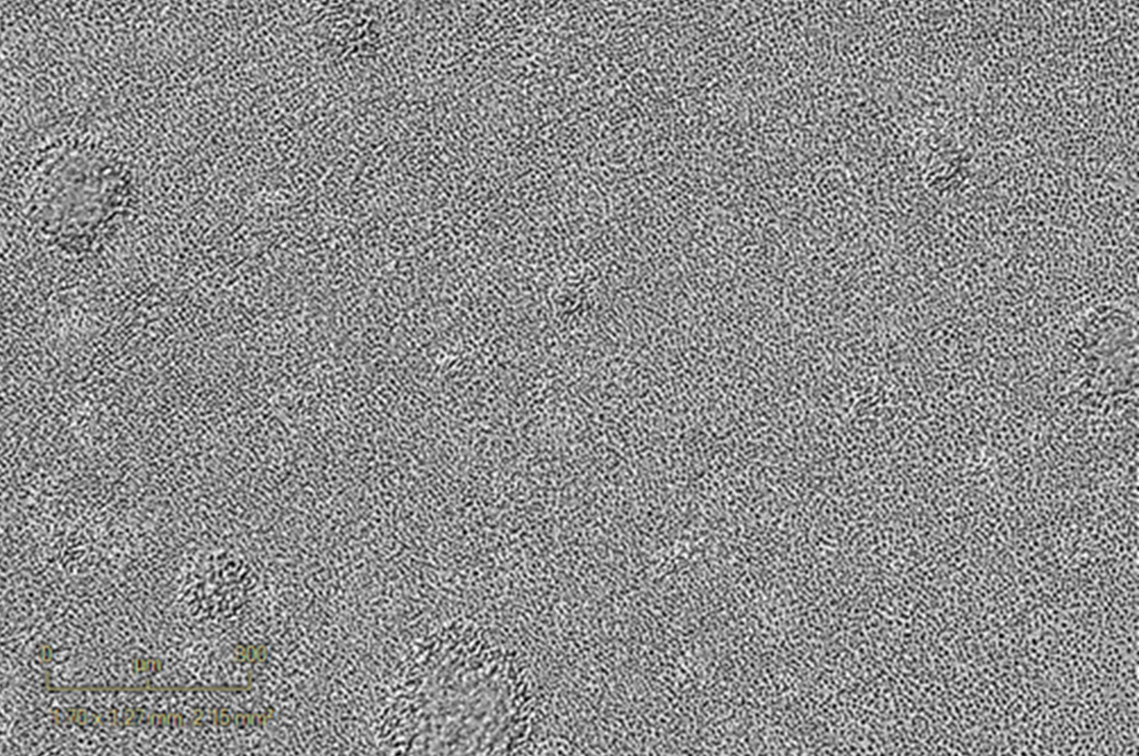
Anti-CD3 activated – 120h Anti-CD3 activated – 120h
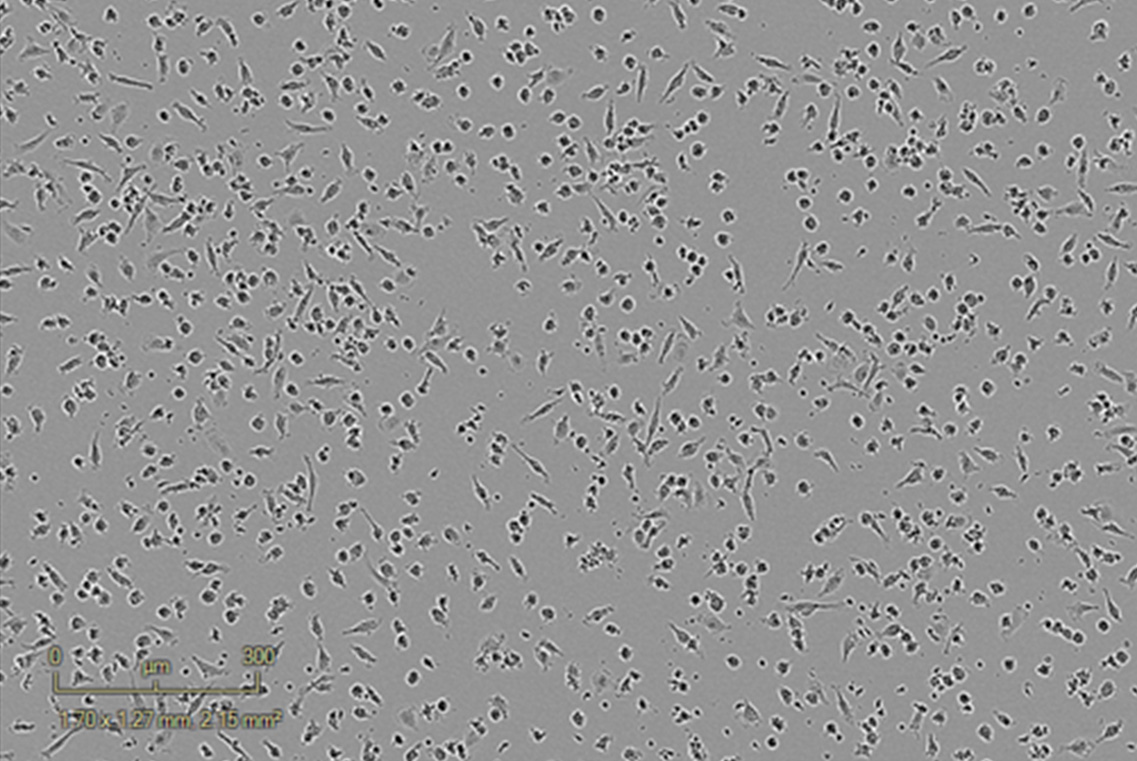
Control – Inactivated PBMCs Control – Inactivated PBMCs

Imane Nafia, PhD, Chief Scientific Officer at Explicyte

The activation of immune cells is the first step in almost any response to immunotherapy, and it can be pushed in either direction. This assay measures that step directly in human primary cells: partners can read whether their compound raises or lowers proliferation and cytokine output, and interpret the effect against reference checkpoint inhibitors run in the same system.

Imane Nafia, PhD

Chief Scientific Officer, Explicyte

Assay principle

From TCR stimulation to a quantified cytokine readout
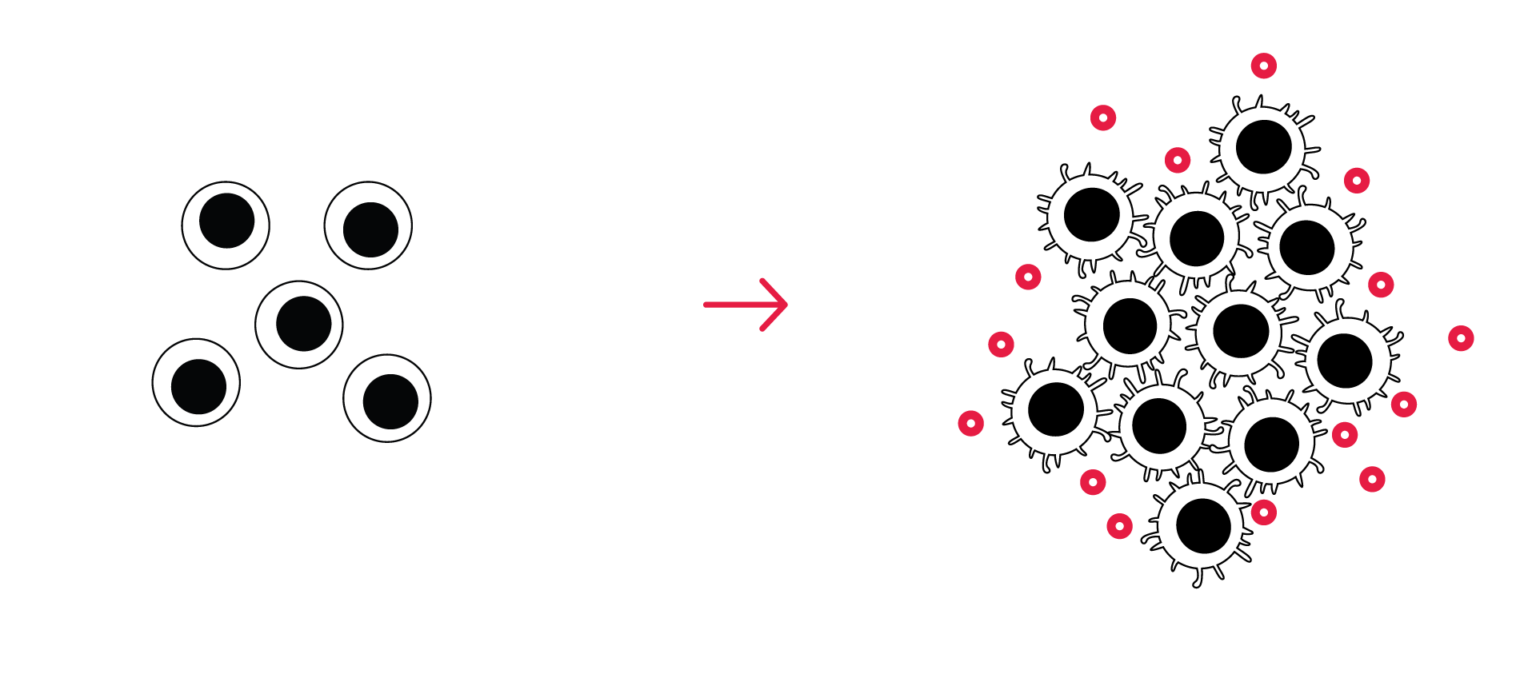
Immune cell activation assay workflow — PBMC/T cell stimulation, live-cell imaging, and cytokine quantification

1

Stimulate through the TCR

PBMCs or purified T cells are incubated with an anti-CD3 activator cocktail for TCR ligation — or another defined immune stimulus.

2

Track proliferation live

Immune cell proliferation and clustering are visualized and measured over time by automated live-cell imaging.

3

Quantify cytokine release

Effector cytokines (IFN-γ, IL-2, TNF-α) are quantified by HTRF or LEGENDplex, functionally confirming the activation state.

illustrative immune cell activation data

The assay reads activation in both directions

Anti-CD3 drives a dose- and time-dependent release of inflammatory cytokines

TNF-α is induced by 24 h, while IFN-γ and IL-2 rise with both anti-CD3 concentration and time. IL-2 and IFN-γ track PBMC activation closely, making them the primary surrogates for activation state.
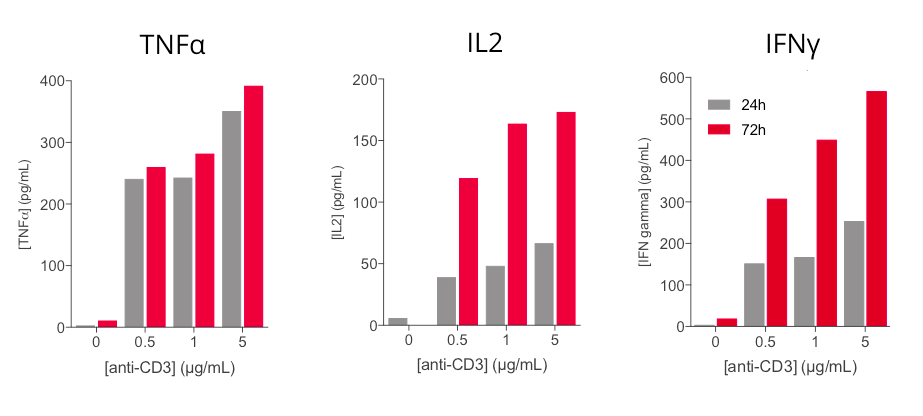
Line graphs of TNF-α, IL-2, and IFN-γ release from human PBMCs across anti-CD3 dose and time

Anti-PD-1 antibodies raise anti-CD3-induced IFN-γ

Adding increasing concentrations of nivolumab or pembrolizumab to anti-CD3-activated PBMCs produces a dose-dependent increase in IFN-γ release, resolving a checkpoint inhibitor's effect on activation.
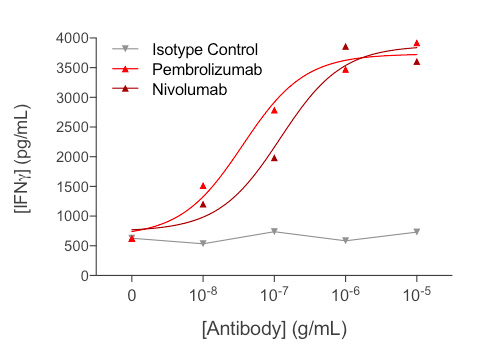
Dose-response of IFN-γ release from anti-CD3-activated PBMCs treated with nivolumab or pembrolizumab

L-kynurenine suppresses the activated T-cell response

In anti-CD3-stimulated primary CD4+ T cells, TNF-α and IFN-γ (HTRF, 72 h) fall dose-dependently with concomitant L-kynurenine — the assay reads immunosuppression as clearly as it reads activation.
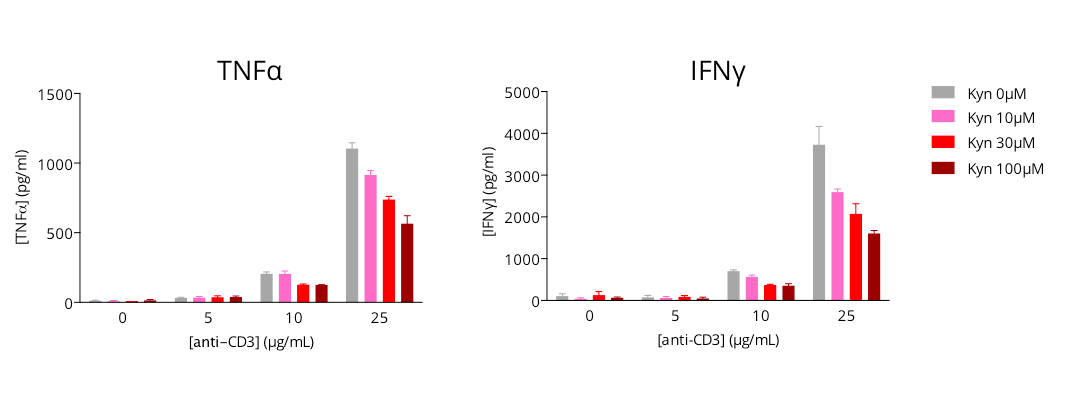
Dose-dependent reduction of TNF-α and IFN-γ in anti-CD3-stimulated CD4+ T cells with L-kynurenine

Making a difference as a preclinical CRO in oncology

Human-primary data, read in both directions and in depth

Ten years of in vitro campaigns

100+ in vitro immuno-oncology campaigns over the past decade, each run by a PhD-level study director from experimental plan through final report.

More about us →

Human primary cells, not lines

Every campaign runs on primary human PBMCs or purified T-cell subsets, so the activation you measure reflects donor biology rather than an immortalized line. About our cell-based assays →

Benchmarked in both directions

Reference checkpoint inhibitors — nivolumab, pembrolizumab, atezolizumab — run in the same system as your compound, so a potentiating or suppressive effect is read against a known scale rather than in isolation.

Discuss your controls →

More than one readout per sample

Beyond proliferation and cytokine release, the same cultures support flow immunophenotyping, cytokine array, proteomics, and transcriptomics — turning an activation screen into a mechanism-of-action study.

See our platforms →

The Explicyte team at their Bordeaux laboratory

Paul Marteau, PharmD (study director), Imane Nafia, PhD (CSO), Loïc Cerf, MSc (COO), Alban Bessede, PhD (founder, CEO), Jean-Philippe Guégan, PhD (CTO)

Contact our team

Discuss your immune cell activation project

Tell us the question you need the immune cell activation assay to answer, and we'll come back with a fit-for-purpose plan. Whether you're screening a single compound or benchmarking against checkpoint standards, a PhD-level study director will scope it with you before anything runs.

Immune cell activation assay: common questions

Frequently asked questions

What does the immune cell activation assay measure?

It measures whether a compound modulates the activation of primary human immune cells — reading both proliferation and effector cytokine release after stimulation through the T-cell receptor. It resolves potentiation and suppression on the same scale.

Primary human PBMCs, or a purified subset such as T cells, depending on the question. Working in primary cells means the response reflects donor biology rather than an immortalized line.

Two readouts run in parallel: proliferation and clustering by automated live-cell imaging over time, and effector cytokine release quantified by HTRF or LEGENDplex at defined timepoints.

IFN-γ, IL-2, and TNF-α as standard. IL-2 and IFN-γ track activation most closely and serve as the primary surrogates; TNF-α is induced earliest, by around 24 hours.

Anti-PD-1 (nivolumab, pembrolizumab) and anti-PD-L1 (atezolizumab), run in the same system as your compound so its effect is benchmarked against a known checkpoint response rather than read in isolation.

Yes. The readout moves in both directions: checkpoint inhibitors raise IFN-γ output, while an immunosuppressor such as L-kynurenine lowers anti-CD3-induced cytokine release dose-dependently.

The same cultures support flow cytometry immunophenotyping (checkpoint and activation markers), cytokine array, proteomics, and transcriptomics — extending an activation screen into a mechanism-of-action study.

Yes. Compounds and antibodies can be run alone and in combination with anti-CD3, which is how checkpoint inhibitors are profiled — reading the added effect on proliferation and cytokine output against the anti-CD3 baseline.

Explicyte Oncology CRO logo

Capabilities

Modalities