Publication in Biomarker Research

Why the most metabolically active soft-tissue sarcomas are also the most immune-infiltrated — and what that means for immunotherapy selection

Explicyte collaborated with: CHU Bordeaux·Inserm·Institut Bergonié
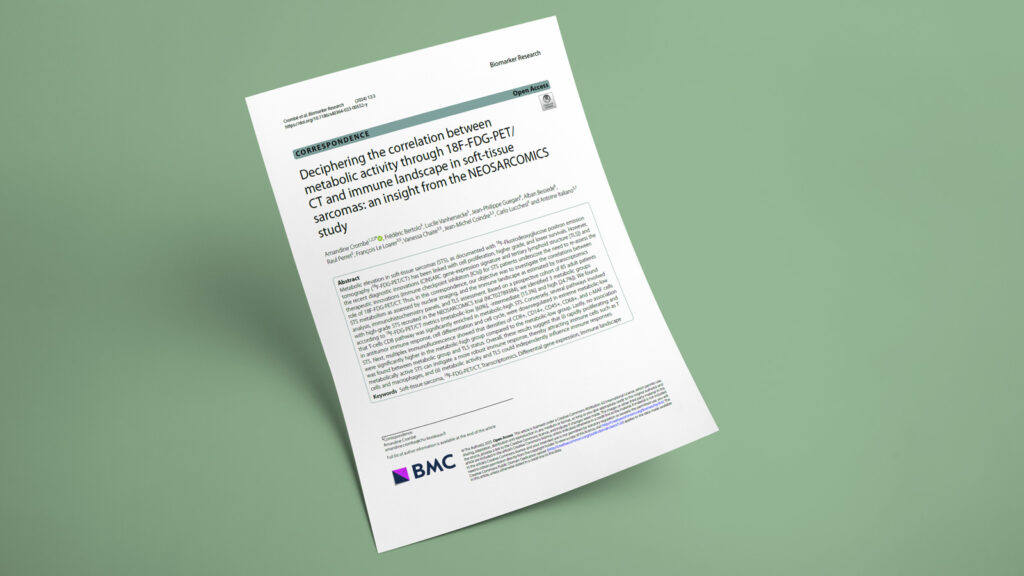
Deciphering the correlation between metabolic activity through 18F-FDG-PET/CT and immune landscape in soft-tissue sarcomas: an insight from the NEOSARCOMICS study
Bone and soft tissueBiomarker analysisBiomarker discoveryDiscoveryTLS scoringTrialsFFPE tissueFresh-frozen tissueBioinformaticsMultiplex IF/IHCRNAseq
JournalBiomarker Research
DateJul 2024
Read full paper →

Immune checkpoint inhibitors help only a small fraction of soft-tissue sarcoma (STS) patients, and there's no reliable, non-invasive way to tell whose tumors are immunologically "hot." Using a prospective cohort of 85 high-grade STS patients from the NEOSARCOMICS trial, the team asked whether metabolic activity on routine 18F-FDG-PET/CT tracks the immune landscape. Tumors classified as metabolic-high showed enriched CD8 T-cell transcriptomic programs and significantly denser CD8+, CD14+, CD45+, CD68+, and c-MAF infiltration than metabolic-low tumors. Tertiary lymphoid structure status was independent of metabolism — pointing to two complementary axes for immunotherapy patient selection.

Published in Biomarker Research, this correspondence comes out of the NEOSARCOMICS precision-medicine trial (NCT02789384), with Amandine Crombé (Institut Bergonié; Pellegrin University Hospital) as first and corresponding author and Prof. Antoine Italiano (Institut Bergonié; INSERM U1312 BRIC, SARCOTARGET team) as senior author. Explicyte was in charge of the multiplex immunofluorescence/IHC immune-profiling panels that anchored the imaging–immune correlation at the protein level.

The question

Does a soft-tissue sarcoma's metabolic activity on 18F-FDG-PET/CT track its immune landscape — and could routine imaging help select patients for immunotherapy?

Key steps

  1. 1

    Stratify tumors by PET metabolism

    The team extracted maximum, mean, and peak SUVs, metabolic tumor volume, and total lesion glycolysis from pre-treatment 18F-FDG-PET/CT for all 85 patients, then ran cross-validated principal component analysis. PC1 — correlated with all PET metrics — split the cohort into three metabolic profiles: metabolic-low (60%), metabolic-intermediate (15.3%), and metabolic-high (24.7%).

  2. 2

    Transcriptomics separates hot from cold

    RNA sequencing on 32 tumors identified 67 differentially expressed genes between metabolic-low and metabolic-high samples, with the CD8 T-cell pathway enriched in the metabolic-high group. In the 7 most extreme metabolic-low tumors, 391 genes were differentially expressed and 13 LM22 immune genesets were suppressed — including ICOS, CD27, interferon-γ, and the CXCL9-10-11/CXCR3 axis — alongside downregulated cell-cycle genes E2F1, CDKN2A, and CCNB1. No association was found with the CINSARC signature (P = 0.176).

  3. 3

    Multiplex IF confirms the signal at the protein level

    Explicyte ran a six-marker multiplex immunofluorescence/IHC panel (c-MAF, CD8, CD14, CD20, CD45, CD68) on 31 patients. Densities of CD8+, CD14+, CD45+, CD68+, and c-MAF cells were significantly higher in metabolic-high than metabolic-low tumors, and correlated positively with metabolism along PC1 (P-value range 0.0247–0.0499). The contrast was stark in matched examples: a metabolic-high tumor (SUVmax 22.4) showed a CD8+ density of 539 mm⁻² versus 1 mm⁻² in a metabolic-low tumor (SUVmax 5.1).

  4. 4

    Show TLS is an independent axis

    TLS status, assessed in all 85 patients, showed no association with metabolic group, PC1, PC2, or any raw PET metric — indicating that tumor metabolism and TLS capture distinct, non-overlapping features of the STS immune microenvironment.

Impact

The findings reframe routine 18F-FDG-PET/CT as a potential non-invasive readout of the sarcoma immune microenvironment — and position metabolism and TLS as complementary, independent stratifiers.

85
high-grade STS patients in the prospective NEOSARCOMICS cohort
539 vs 1
CD8+ cell density (mm⁻²) in a metabolic-high vs metabolic-low example tumor
5–15%
ICI response rates in unselected STS — the stratification gap this addresses

For drug developers, metabolic imaging that patients already receive could enrich immunotherapy trials by flagging immunologically active sarcomas non-invasively. Because metabolism and TLS status move independently, combining PET metrics with TLS scoring may stratify STS patients better than either alone. The immune-suppressed profile of extreme metabolic-low tumors — with silenced IFN-γ and CXCL9/10/11 signaling — also marks a subset unlikely to respond to checkpoint blockade without combination strategies.

Correlating imaging phenotypes with the tumor immune microenvironment in your sarcoma program? Let's talk about multiplex IF and immune profiling.

Talk to us
Explicyte Oncology CRO logo

Capabilities

Modalities