
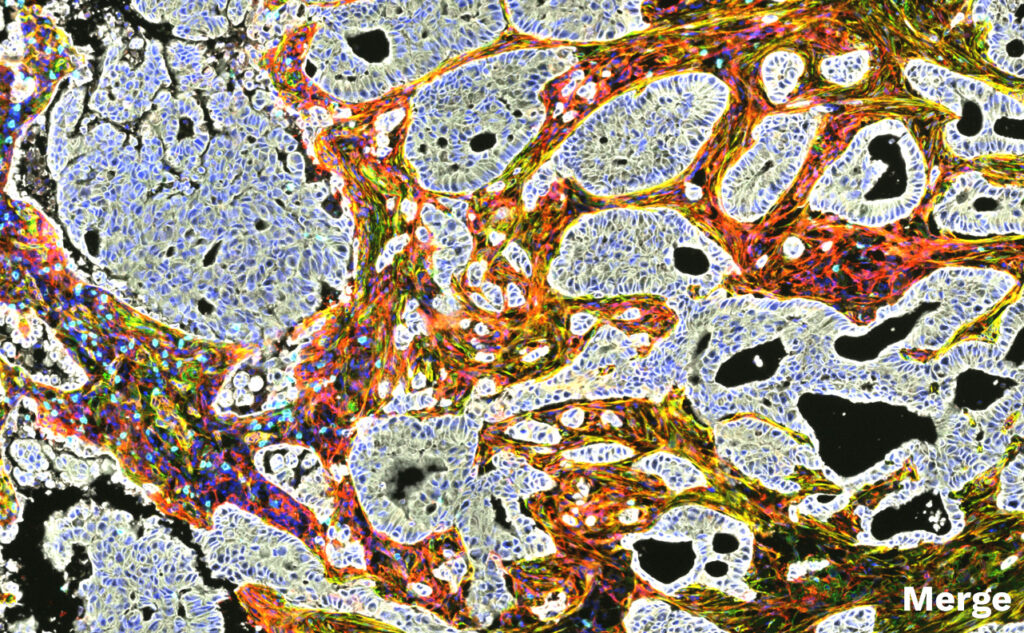
The challenge: Understanding not only which cells are present, but where they are
The tumor microenvironment contains multiple immune and stromal populations whose biological impact depends on both phenotype and tissue localization. In NSCLC, identifying exhausted T-cell populations or cancer-associated fibroblasts alone provides only part of the picture: their distribution between tumor and stroma and their proximity to tumor cells can provide additional information on the organization of the immune microenvironment.
The objective was therefore to combine multiplex protein detection with quantitative image analysis to characterize specific cell populations and preserve their spatial context.
The approach: Multiplex immunofluorescence combined with pathologist-guided quantitative analysis
- Multiplex staining of FFPE tumor sections using panels designed to resolve immune-exhaustion and stromal phenotypes.
- Multispectral whole-slide imaging to capture individual markers and multiplexed signals.
- Tissue and cell segmentation to distinguish tumor and stromal compartments and identify defined cell phenotypes.
- Quantitative and spatial analysis to measure cell frequencies, densities and distances between selected cell populations.
Findings
Multiplex phenotyping resolves exhausted tumor-infiltrating T cells
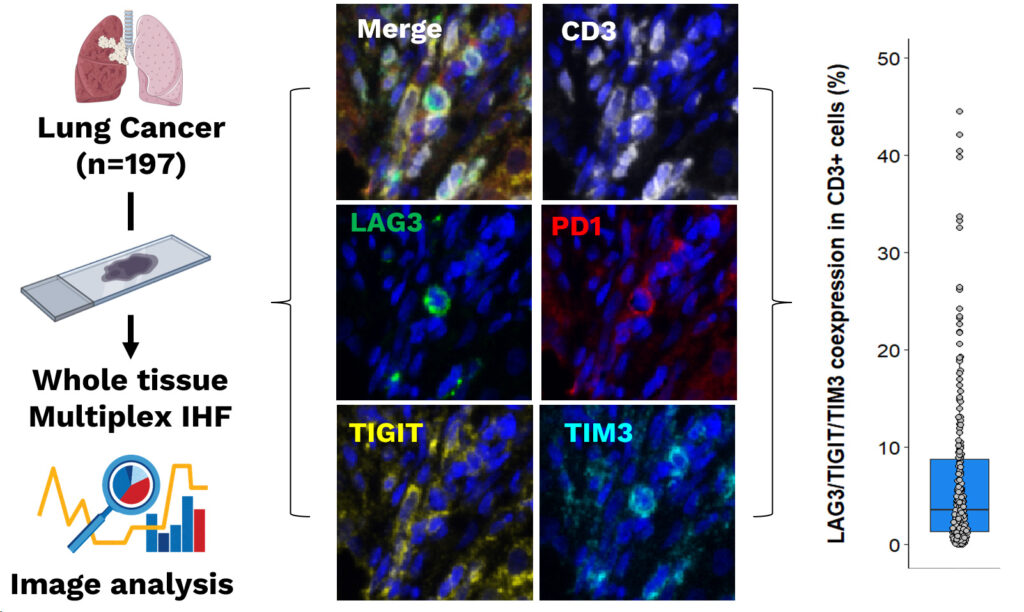 Tumor samples from 197 lung cancer patients were analyzed using a multiplex immunofluorescence panel combining CD3, LAG3, PD-1, TIGIT and TIM3. Quantitative image analysis was used to determine the proportion of T cells expressing selected exhaustion markers and revealed substantial inter-patient variability in these phenotypes.
Multiplex IF converts co-expression of several immune-checkpoint markers into patient-level quantitative phenotypes.
Compartment-aware analysis identifies distinct CAF phenotypes
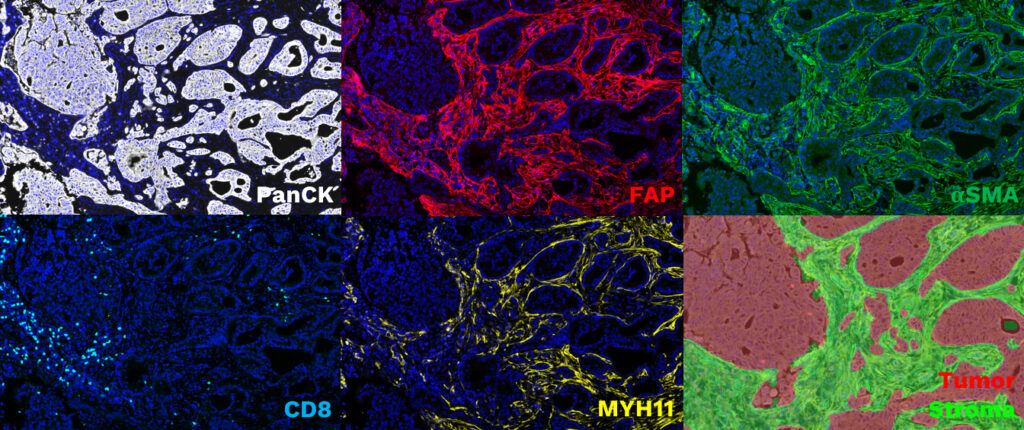
A multiplex panel combining PanCK, CD8, FAP, MYH11 and αSMA was applied to FFPE NSCLC adenocarcinoma tissue. Image analysis separated tumor and stromal compartments, allowing fibroblast-marker expression and immune-cell distribution to be evaluated within their appropriate anatomical context.
Tissue segmentation prevents biomarker expression from being interpreted independently of the compartment in which it occurs.
Spatial analysis measures how exhausted T cells are organized around tumor cells
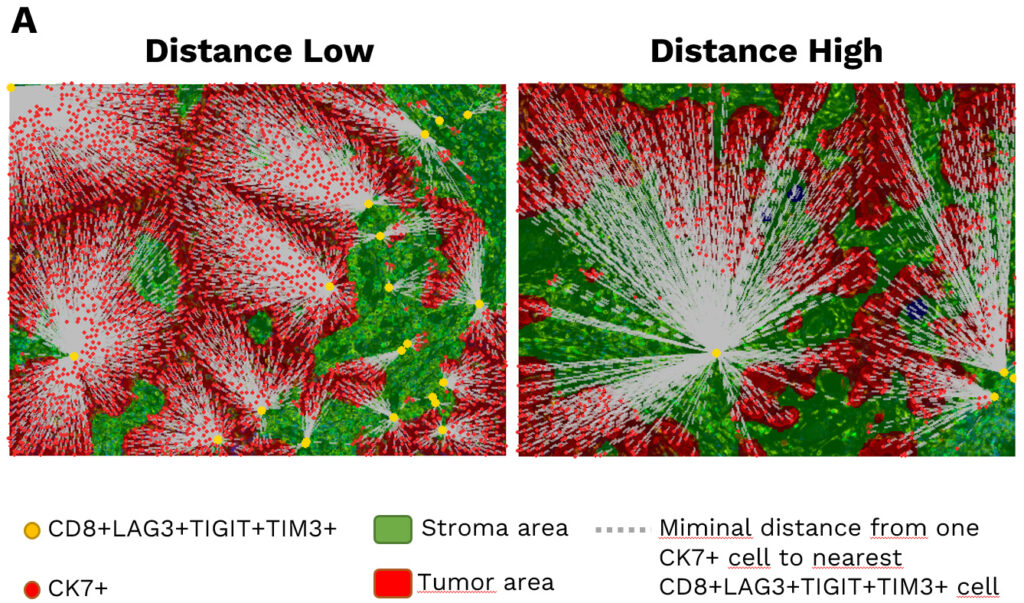
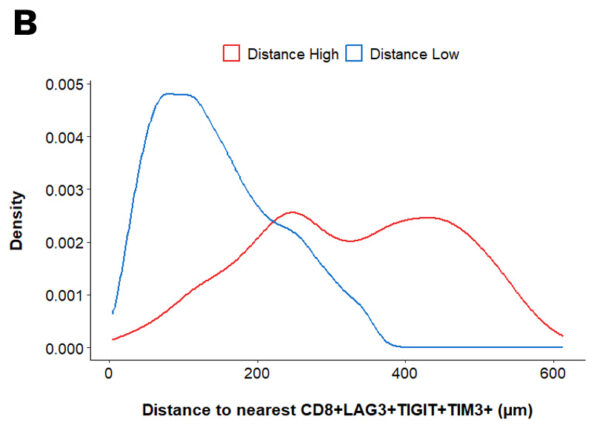
Beyond cell counting, Explicyte quantified the spatial relationship between epithelial tumor cells and exhausted T-cell populations. (A) Illustration of the calculated distances between epithelial tumor cells (CK7 positive) and tumor-infiltrating CD8+LAG3+TIGIT+TIM3+ cells. Tumor and Stroma areas are highlighted in red and green, respectively. (B) Density plot of the median distances of CK7+ to nearest CD8+LAG3+TIGIT+TIM3+ in patients classified as “Distance High” (red line) and “Distance Low” (blue line).
Spatial metrics add information that cell abundance alone cannot capture.
The outcome: One workflow, multiple levels of biological information
These analyses illustrate how multiplex digital pathology can interrogate the tumor microenvironment at progressively deeper levels: identifying complex cell phenotypes, assigning them to defined tissue compartments, and quantifying their spatial relationships with neighboring cell populations.
By integrating pathology, multiplex staining, multispectral imaging and quantitative analysis, the workflow generates interpretable tissue biomarkers while preserving the architecture in which those biomarkers occur.