mIF & IHC image analysis services for digital pathology

Explicyte provides standalone image analysis for digitized mIF and IHC slides, including tissue and cell segmentation, machine learning-assisted phenotyping, quantitative biomarker analysis and spatial analysis.

We can analyze images generated by Explicyte or externally, with pathology input where relevant.

WHY EXPLICYTE

Your digitized slides are in good hands

Fast turnaround

Analysis depth and cohort size determine timeline, with in-depth projects typically scoped around a four-week turnaround.

Pathology input where relevant

Consulting histopathologists can support tissue review, compartment definition and interpretation where appropriate to the study.

Machine learning with expert review

Machine learning accelerates the analysis; a bioinformatician interprets the data.

Explicyte is certified ISO 9001:2015 and ISO 13485:2016 by Euro-Quality System (certificates 260133/1637F/1 and 260133/1637F/2). Scope: Precision Oncology — design and development of tissue biomarkers, and tissue biomarker testing services to support therapeutic decision-making. The certification governs our histopathology workflow; the image-analysis pipeline is delivered by the same team but sits outside the certified scope.

A decade of experience in mIF & IHC image ANALYSISrk

30+ publications featuring our digital pathology data
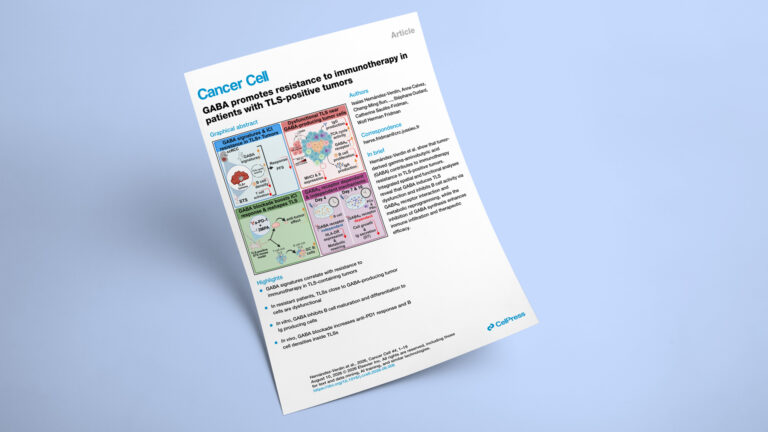
GABA promotes resistance to immunotherapy in patients with TLS-positive tumors
GABA promotes resistance to immunotherapy in patients with TLS-positive tumors

2026
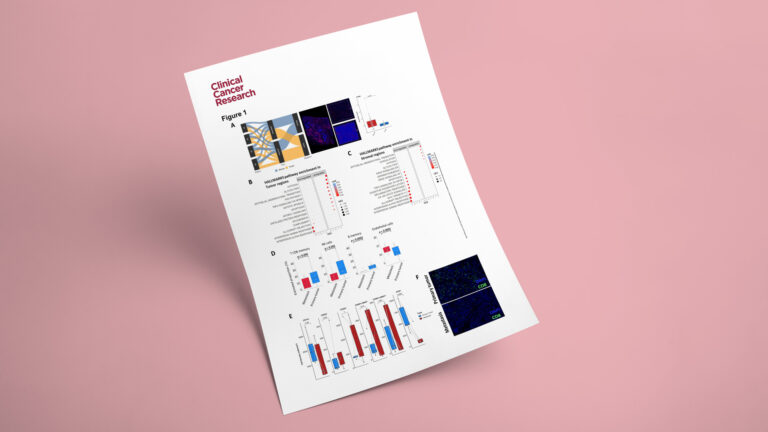
Adenosine A2B Receptor Promotes Tumor Progression and Metastases in Undifferentiated Pleomorphic Sarcoma

Adenosine A2B Receptor Promotes Tumor Progression and Metastases in Undifferentiated Pleomorphic Sarcoma

2026
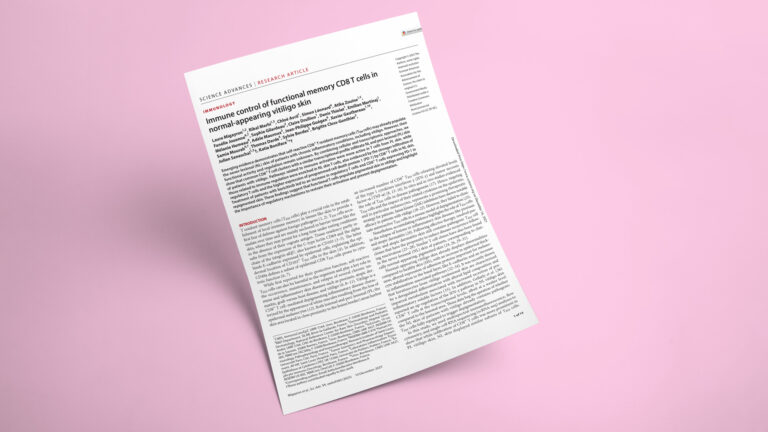
Immune control of functional memory CD8 T cells in normal-appearing vitiligo skin
Immune control of functional memory CD8 T cells in normal-appearing vitiligo skin

2025
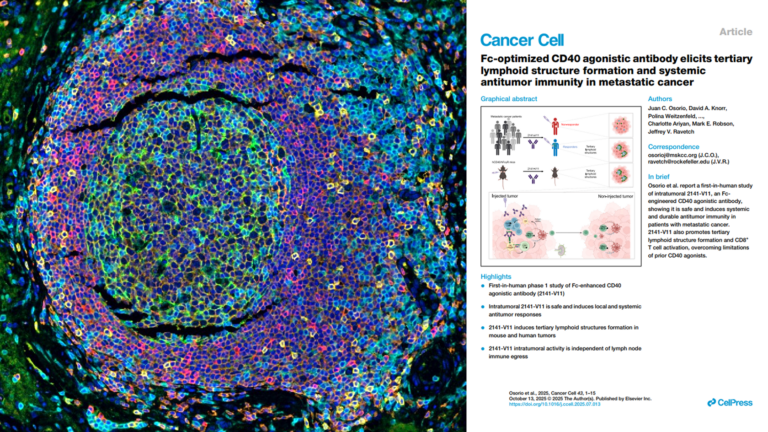
Fc-optimized CD40 agonistic antibody elicits tertiary lymphoid structure formation and systemic antitumor immunity in metastatic cancer

Fc-optimized CD40 agonistic antibody elicits tertiary lymphoid structure formation and systemic antitumor immunity in metastatic cancer

2025
Reshaping the tumor microenvironment of cold soft-tissue sarcomas with anti-angiogenics: a phase 2 trial of regorafenib combined with avelumab

Reshaping the tumor microenvironment of cold soft-tissue sarcomas with anti-angiogenics: a phase 2 trial of regorafenib combined with avelumab

2025
Regorafenib plus avelumab in advanced gastroenteropancreatic neuroendocrine neoplasms: a phase 2 trial and correlative analysis


Regorafenib plus avelumab in advanced gastroenteropancreatic neuroendocrine neoplasms: a phase 2 trial and correlative analysis

2025
Spatially resolved transcriptomics reveal the determinants of primary resistance to immunotherapy in NSCLC with mature tertiary lymphoid structures

Spatially resolved transcriptomics reveal the determinants of primary resistance to immunotherapy in NSCLC with mature tertiary lymphoid structures

2025
Tertiary lymphoid structures and cancer immunotherapy: From bench to bedside
Tertiary lymphoid structures and cancer immunotherapy: From bench to bedside

2025
Analysis of PD1, LAG3, TIGIT, and TIM3 expression in human lung adenocarcinoma reveals a 25-gene signature predicting immunotherapy response

Analysis of PD1, LAG3, TIGIT, and TIM3 expression in human lung adenocarcinoma reveals a 25-gene signature predicting immunotherapy response

2024
Predictive value of tumor microenvironment on pathologic response to neoadjuvant chemotherapy in patients with undifferentiated pleomorphic sarcomas

Predictive value of tumor microenvironment on pathologic response to neoadjuvant chemotherapy in patients with undifferentiated pleomorphic sarcomas

2024
Identification of microenvironment features associated with primary resistance to anti-PD-1/PD-L1 + antiangiogenesis in gastric cancer through spatial transcriptomics and plasma proteomics
Identification of microenvironment features associated with primary resistance to anti-PD-1/PD-L1 + antiangiogenesis in gastric cancer through spatial transcriptomics and plasma proteomics

2024
Deciphering the correlation between metabolic activity through 18F-FDG-PET/CT and immune landscape in soft-tissue sarcomas: an insight from the NEOSARCOMICS study

Deciphering the correlation between metabolic activity through 18F-FDG-PET/CT and immune landscape in soft-tissue sarcomas: an insight from the NEOSARCOMICS study

2024

WHAT WE EXTRACT

From digitized slide to quantitative spatial biology

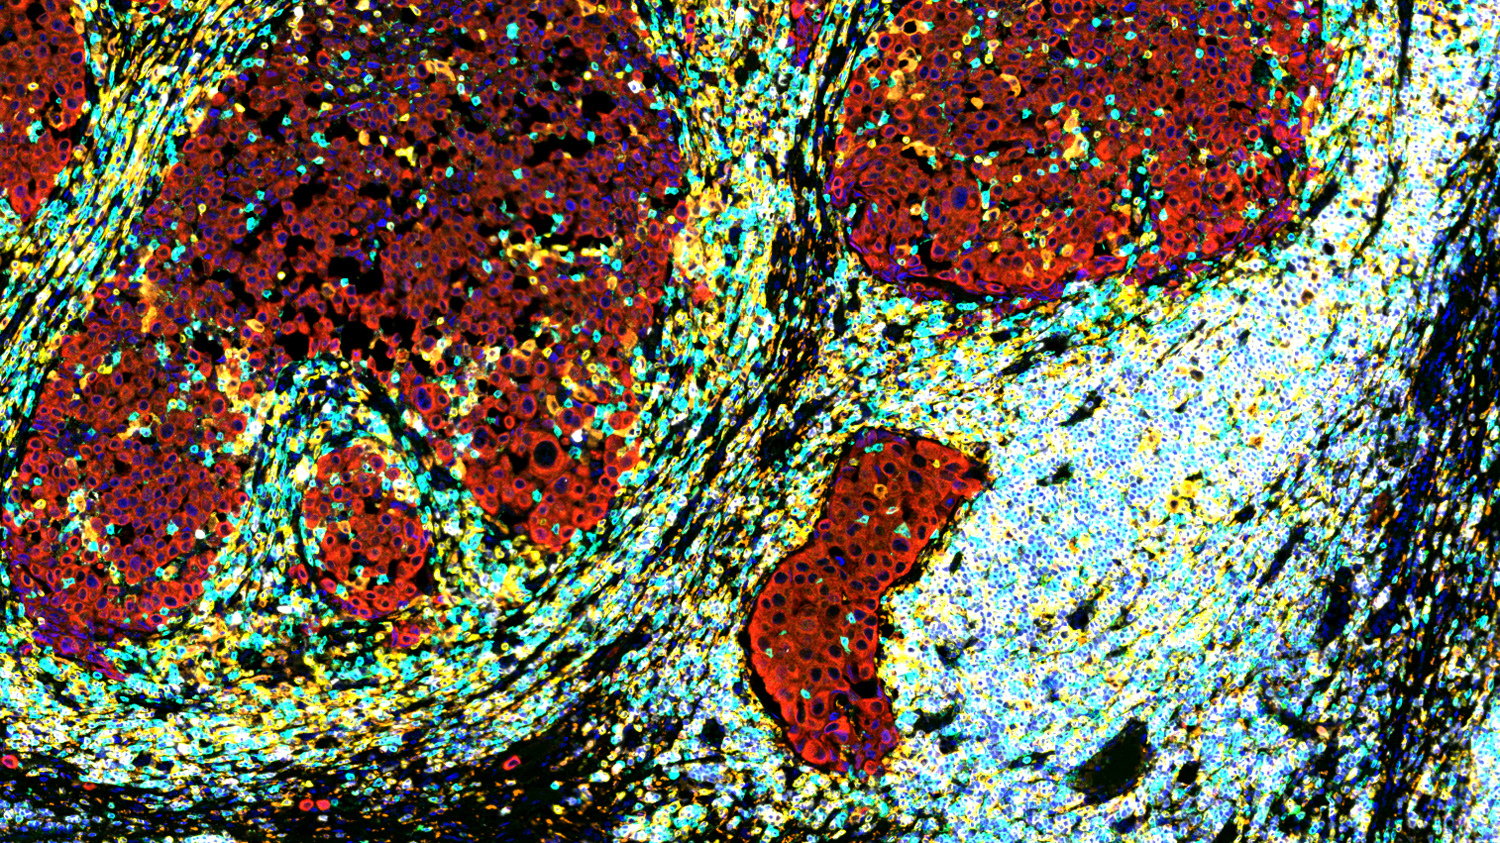
Tissue segmentation
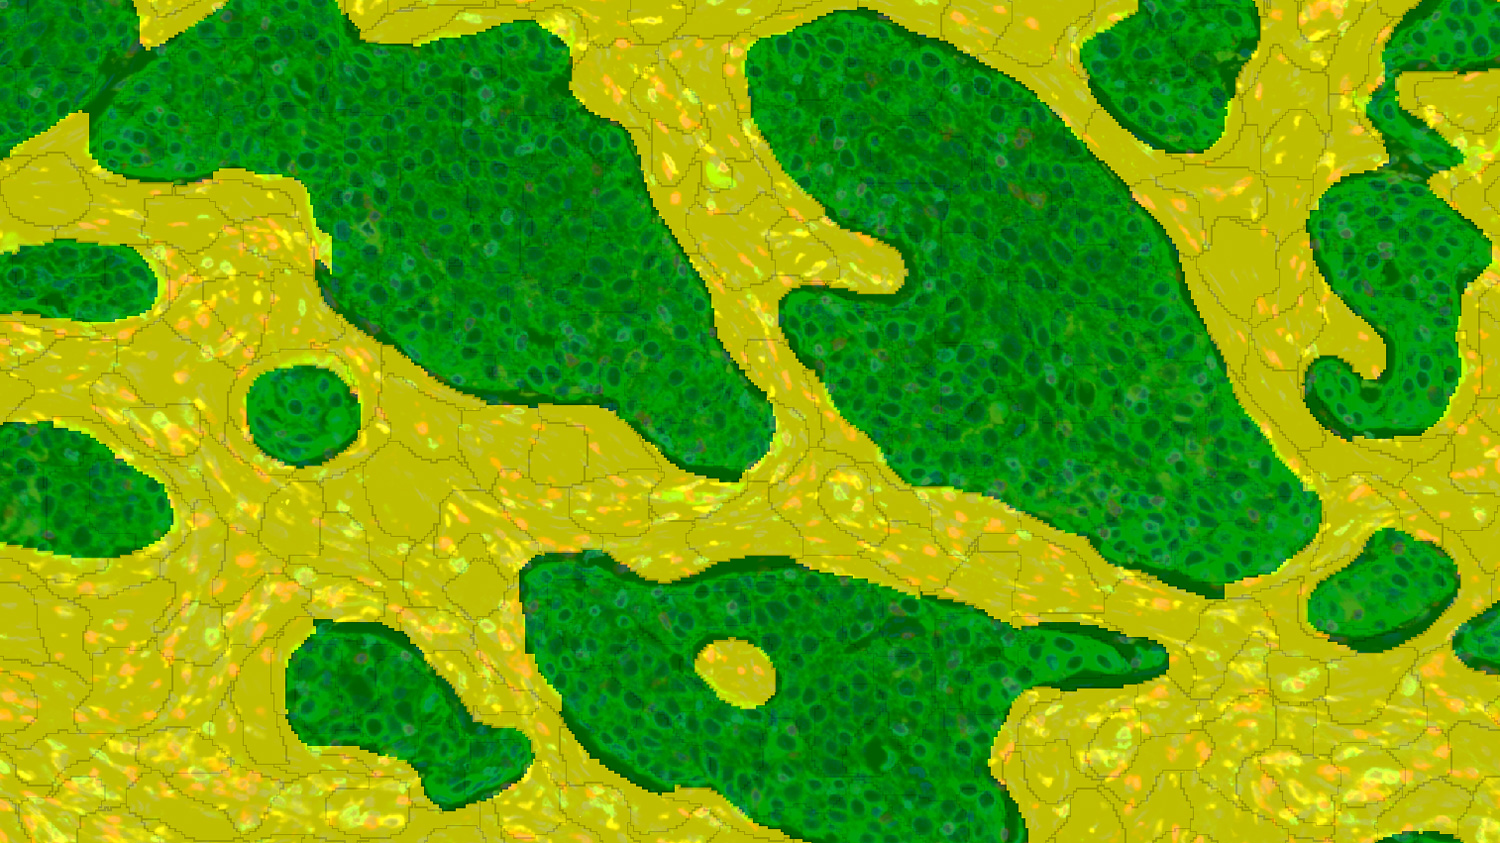
Machine-learning-driven analysis of tissue architecture based on pixel classification.

Tissue segmentation Tissue segmentation
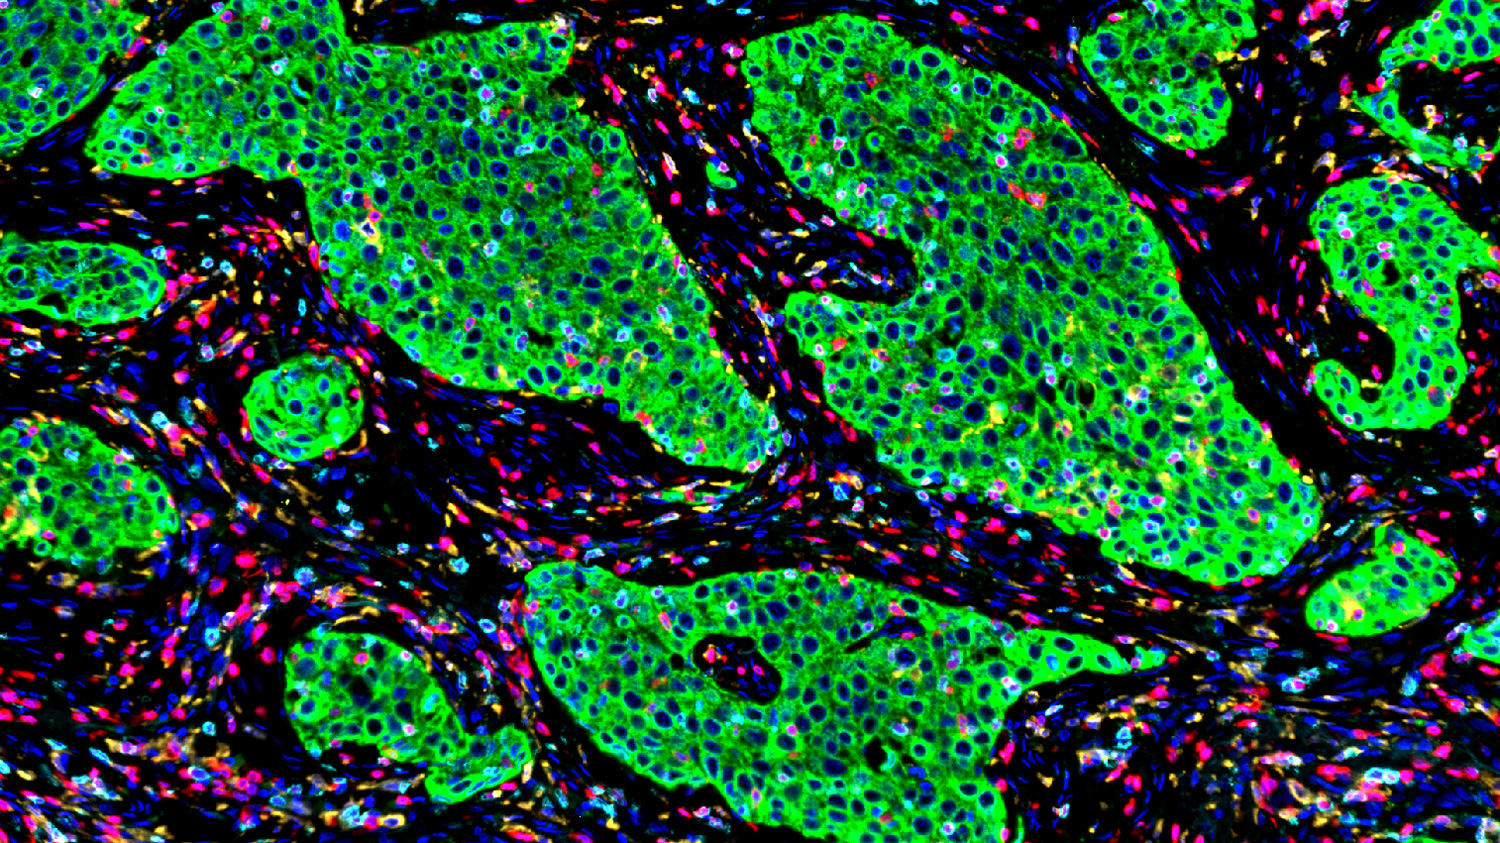
mIF mIF

NSCLC adenocarcinoma stained with a 5-marker mIF panel (CD8 cyan, CD4 red, CD163 yellow, PanCK green, DAPI blue). Tissue was segmented into superpixels and automatically classified into Tumor (green) and Stroma (yellow) compartments using machine-learning methods trained on histology-annotated regions.

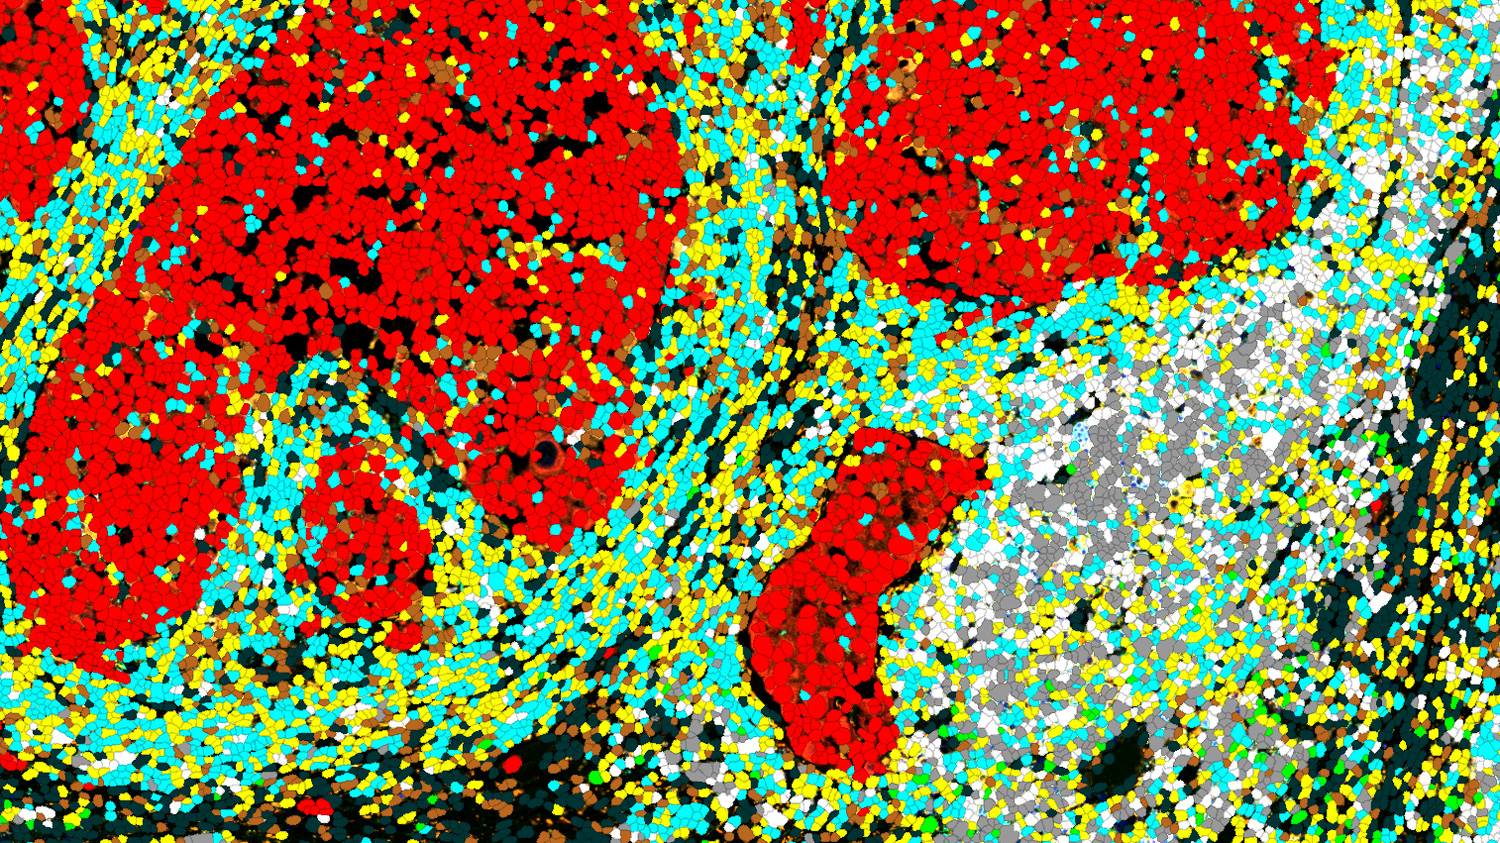
Cell segmentation & phenotyping

Quantitative cell identification and characterization through in-house segmentation workflows

Cell segmentation Cell segmentation
mIF mIF

NSCLC adenocarcinoma stained with a 7-marker mIF panel (CD3, CD8, CD20, CD23, CD163, PanCK, DAPI). Cells were segmented, normalized, and phenotyped: macrophages (orange), B cells (white), mature B cells (grey), follicular dendritic cells (green), CD4 T cells (yellow), CD8 T cells (cyan), tumor cells (red).

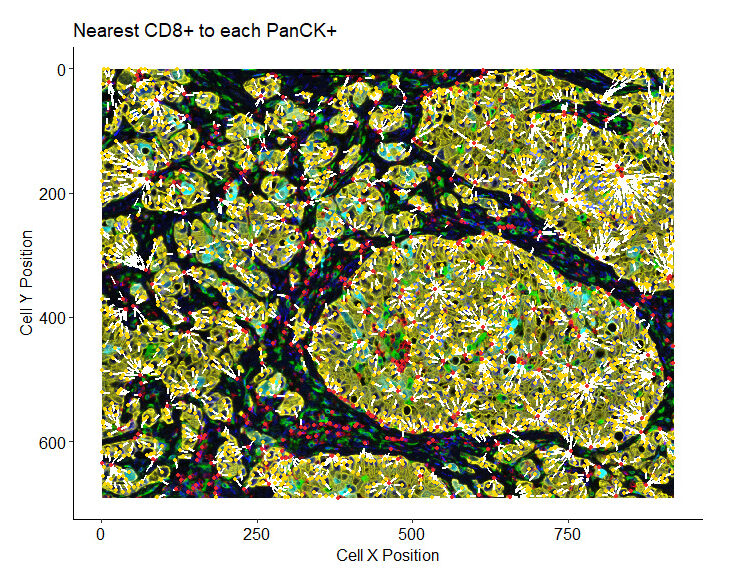
Spatial analysis

Detailed analyses of spatial relationships, including nearest-neighbor distances, spatial heterogeneity, and cellular colocalization.

nearest neighbour analysis CRO oncology

An NSCLC adenocarcinoma sample after multiplex mIF phenotyping. Nearest-neighbor distances between PanCK-positive (tumor) and CD8-positive (cytotoxic T) cells are shown as white dashed lines, revealing spatial heterogeneity of the CD8 infiltrate across the tissue.

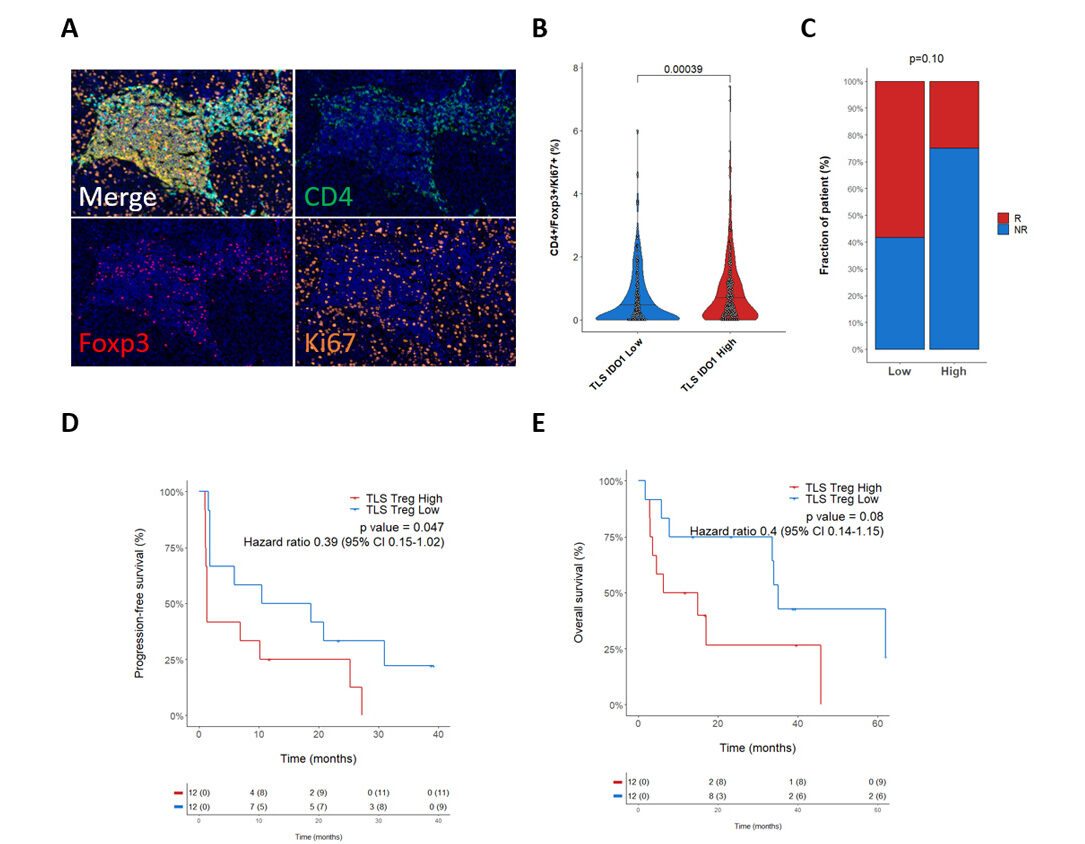
Custom quantitative analysis

Quantitative analyses tailored to the study question, including marker-expression profiling, object measurements, cell-density analysis, spatial metrics and integration with clinical or biological metadata.

Tailored bioinformatic analysis pathology marker expression object measurement density analysis and correlation with metadata

IDO1 expression profiled across TLS Treg-high vs Treg-low subgroups in NSCLC, with progression-free and overall survival stratification. Bessede et al. Clin Cancer Res . 2023

ANALYSIS DEPTH

Choose the level of image analysis you need

One workflow, three depths Choose the level that matches your project. Level 1 · QC ~1 week Image quality assessed and QC summarized. Level 2 · Primary ~2 weeks Cells segmented, phenotyped and quantified. Level 3 · In-depth ~4 weeks Spatial and comparative biological interpretation.
Slide quality assessment & artifact detection
QC report with image metrics
Artifact removal & cohort-level image normalization
Nucleus & cell segmentation
Marker signal extraction
Multiplex marker co-expression analysis
ML-assisted cell phenotyping
Tissue compartment classification (tumor / stroma / immune zones)
ROI-level & cell-level quantitative summaries
Cell–cell interaction & neighborhood analysis
Nearest-neighbor distances & colocalization
Comparative analysis across cohorts or conditions
Publication-ready figures & full analytical report

Also available on request

Pathologist-scored biomarkers (TPS · CPS · H-score) · image registration where required · unsupervised phenotype discovery · advanced spatial statistics (Ripley's K, neighborhood enrichment) · multiomic integration.

explicyte multiomics transcriptomics CRO team

Paul Marteau, PharmD (study director), Imane Nafia, PhD (CSO), Loïc Cerf, MSc (COO), Alban Bessede, PhD (founder, CEO), Jean-Philippe Guégan, PhD (CTO)

Contact our team

Discuss your image-analysis project

Tell us the image type, staining or marker panel, cohort size and biological question. Our team will review the available data and propose the appropriate analysis depth, timeline and deliverables.

Answers about miF/IHC image analysis

Frequently asked questions

Can Explicyte analyze mIF and IHC slides generated outside Explicyte?

Yes. Our image analysis is a standalone service, so we can support projects even when staining, slide scanning, or assay development was done by another laboratory, CRO, or your internal team.

Digitized slides from multiplex immunofluorescence (mIF) and immunohistochemistry (IHC) workflows. Depending on the project we work from whole-slide images, ROI images, multiplex marker images, pre-processed images, or segmentation masks.
Whole digitized slides or ROI images upload to our secure EU-based infrastructure (AES-encrypted storage, high-speed transfer).

We offer three levels of analysis depending on the depth required.

Level 1 — QC assesses image quality, artifacts and dataset consistency and provides a QC summary.

Level 2 — Primary adds image normalization, nucleus and cell segmentation, marker-signal extraction, multiplex co-expression analysis, ML-assisted cell phenotyping, tissue-compartment classification and quantitative cell- and ROI-level outputs.

Level 3 — In-depth adds spatial analyses such as cell–cell interactions, neighborhood analysis, nearest-neighbor distances and colocalization, together with comparative analyses across groups and publication-ready figures and reporting.

Yes. In-depth analyses can include nearest-neighbor distances, colocalization, neighborhood analysis and other spatial statistics to characterize how cell populations are organized within the tissue microenvironment.

Yes. We can classify tissue compartments, segment individual cells, extract marker intensities and define cell phenotypes from multiplex marker expression. Machine-learning methods can support tissue classification and cell phenotyping where appropriate, with scientific review of the resulting populations.

Yes. Explicyte has extensive experience analyzing mIF and IHC data from FFPE material, including archived tumor cohorts, preclinical samples and patient biopsies. The analysis workflow is adapted to image quality, staining characteristics and study objectives.

Explicyte is certified ISO 9001:2015 and ISO 13485:2016 by Euro-Quality System (certificates 260133/1637F/1 and 260133/1637F/2). The certification scope covers the histopathology workflow — design and development of tissue biomarkers, and tissue biomarker testing services.

Image analysis is delivered by the same team but sits outside the certified scope.

Where a project combines image analysis with activities within our certified histopathology scope, the respective workflows and deliverables are defined separately during study setup.

Yes. Depending on the package, deliverables include quantitative tables, spatial maps, annotated datasets, structured reports, and figures ready for manuscripts, abstracts, or presentations.

Biotech and pharmaceutical companies, academic teams, and translational research groups that need expert interpretation of digitized pathology slides.

Explicyte Oncology CRO logo

Capabilities

Modalities